Self-storage buildings are facilities in which individual enclosed units, typically ranging in size between 50 sf to 400 sf each, are rented to private and commercial users to store items for the short-term. The concept originated in 1954 in San Antonio, TX to serve military members who needed to store their belongings. By the 1970s, the self-storage concept had gained wider commercial appeal (from a number of alternative users) and became an established business, commonly known as “mini-storage”. Today, self-storage generates US$ 32.70 billion in aggregate revenues (Source: IBISWorld), and is considered an “alternative" real estate asset class.
(A) Fundamentals for self-storage: demand and supply factors, which influence rental and occupancy rates.
Key demand drivers: Key demand drivers for the sector have been favorable in the past 5 years, which include positive population growth, strong job creation, internal migration, rising household income, and declining living space:
-
Population growth: Household formation and number of residents are the main drivers for demand of self-storage space. The trend has been favorable; the US population increased from 309.3 million in 2010 to 324.9 million in 2016, an annual growth rate of 0.86%. The trend is projected to continue at a healthy rate of 0.70% over the next 5 years.
The Metros with population growth higher than the national average are more desirable self-storage locations. The favored cities include Dallas-Ft. Worth (1.35% CAGR), Phoenix (1.38% CAGR), Houston (1.33% CAGR), Atlanta (1.34% CAGR), and Los Angeles (1.23% CAGR).
- Employment growth: After the 2008 financial crisis, the U.S. economy added 14.97 million non-farm jobs between December 2009 and December 2016. Current non-farm total employment stands at 144.7 million, exceeding the previous peak level (in January 2008) by 6.3 million. The current unemployment rate is 4.8% (BLS).
- Internal migration: Residential migration is a major driver of demand for self-storage space during transitional periods. The top 5 states for internal residential migration within the U.S are Washington State, California, Texas, Florida, and North Carolina.
- Rising Median Household Income: Median household income has a strong correlation with need and affordability of additional space for storage. Since the downturn in 2008 and 2009, the U.S. median household income has increased at a CAGR of 1.35% reaching US$ 56,516. Median household income is considered an affordability metric for residents of the area surrounding the self-storage facility (please see below).
- Smaller residential units: The average apartment size in a multifamily property declined form 1,247sf in 2014, to 1,102 sf by year-end 2015. 53% self-storage users state that the primary reason behind having items stored is lack of space, this is followed by the need of temporary storage when moving, and having unwanted or unneeded items.
Supply: The key supply metric for the self-storage market is he average stock of self-storage per capita. The national average of self-storage space per capita is 7.7 sf (Source: Self-Storage Almanac).
According to Cushman & Wakefield, new self-storage supply is at its highest level since 2006. New developments are generally focused on population growth centers.
It is also important to note that the market for self-storage still remains fragmented. The largest 10 players represent 20.52% of the total self-storage square footage.
Key results: The combination of strengthening demand and increasing amounts of supply (to cater to such demand) have translated into increasing rental growth as well as higher occupancy rates.
- Climate Controlled: Average U.S climate controlled rental rates increased to $ US 1.62/sf signifying a 3.6% increase in rental rates in comparison to 2015 (Marcus & Millichap).
- Non-Climate Controlled: Average U.S non-climate controlled rental rates increased to $ US 1.29/sf signifying a 4.0% increase in rental rates in comparison to 2015 (Marcus & Millichap).
- Occupancy: The average occupancy rate for publicly listed self-storage REITs has increased since 2014. Occupancy rates increased from 89.9% in 2014 to 91.5% in 2015 (MJ Partners).
Supply: The key supply metric for the self-storage market is he average stock of self-storage per capita. The national average of self-storage space per capita is 7.7 sf (Source: Self-Storage Almanac).
When investing in self-storage projects, we look at the following parameters:
- Population within a 3-mile radius should generally exceed 100,000: A densely populated area provides a strong demand base for a self-storage facility.
- Median household income within a 3-mile radius should generally exceed US$ 50,000: Reasonably high median household incomes indicate a greater affordability and need for self-storage facilities.
- Traffic count: A high number of vehicles passing by the property on a daily basis (e.g. 20,000 +) indicates that the property is located on a key route and is visible for future users.
- Supply situation: We try to invest in areas where the overall supply within the sub-market is below the national average supply of 7.8 sf/person within a 3-mile radius (unless otherwise justified due to above-average demand).
- Competing properties and their occupancy: We look into competing properties to assess rental rates while adjusting for differences in quality and specifications. We typically target sub-markets which have high occupancy rates (e.g. 90% and above)
(B) Capital Markets: availability of capital, which influence transaction volumes, sales prices, and cap rates.
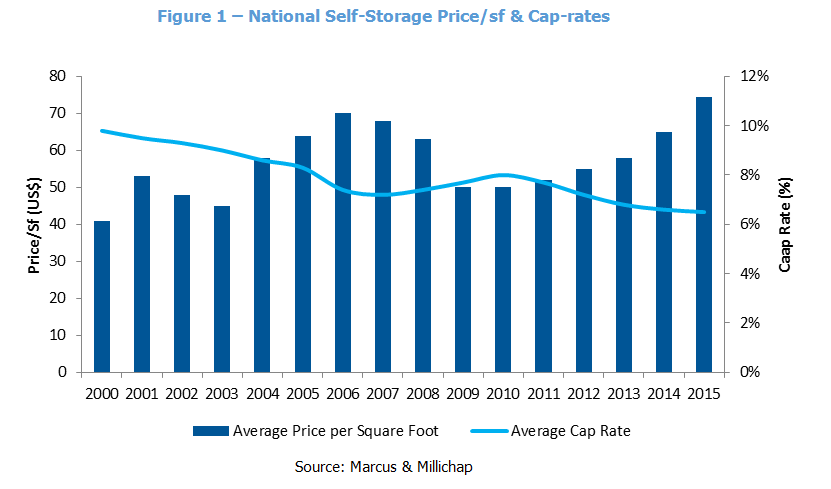
As yields on core real estate have declined, institutional investors (pension funds, REITs, etc.) have been increasing their allocation to alternative real estate, including self-storage, in order to enhance the average yield on their real estate portfolios. The self-storage segment became a prime beneficiary of this trend: it is becoming increasingly institutional, and prime (Class A) properties are now trading currently at cap rates below 5%. As shown in Figure 1 below, the weighted average cap rates (Class A through C) for self-storage properties in 2016 was at 6.4%; a steep decline form 9.5% in 2000.
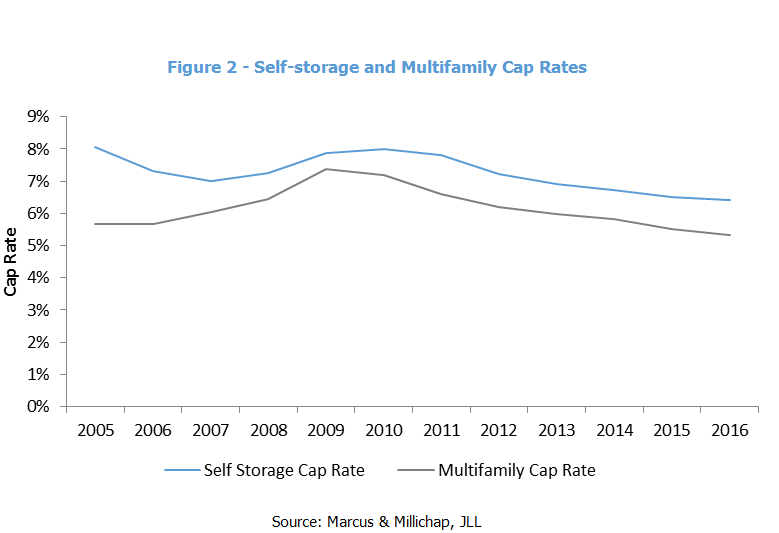
Furthermore, the spread between multifamily and self-storage cap rates has decreased over the last 10 years as shown in the table below. This reflects the increasing desirability of self-storage properties by institutional buyers, which has triggered higher transaction volumes and lower liquidity risk premiums for such assets. The spread between self-storage and multifamily cap rates has declined from 240 bps in 2005 to 107 bps in 2016.
In addition, during times of economic crisis (e.g. 2008 and 2009), the spread between self-storage and multifamily cap rates decreases due to the perception of self-storage being a counter-cyclical sector.
Key self-storage investors: As mentioned above, the growing pool of self-storage buyers has increased considerably over the past 10 years. Today, buyers for self-storage include:
- Self-Storage REITs: in 2015 the transaction volume for self-storage REITS reached $US 2.8 billion. Key players in the segment include: Public Storage, Extra Space Storage, CubeSmart, Sovran, National Storage Affiliates. In addition, there are a large number of private REITs actively participating in this segment.
- Diversified REITs: Northstar Realty Finance Corp., W.P. Carey Inc., Investor Real Estate Trust, ACRE Reality Investors, Inc.
- Pension funds: a number of pension funds have separate allocations for self-storage acquisitions.
- Regional and high net worth families.
Due to a lack of high quality properties available for sale, a larger number of investors are seeking to undertake greater amounts of leasing risk, e.g. sales completed upon receipt of certificate of occupancy.
This article is published in “Engage Q1-2017” – click to view the publication
